

Usage
Description
W&B LEET: the Lightweight Experiment Exploration Tool. A terminal UI for viewing your W&B runs locally.Subcommands
W&B LEET, the Lightweight Experiment Exploration Tool, is a local terminal UI for exploring W&B runs from the command line. Use it to compare runs, inspect metric charts, browse logged images, tail console logs, and watch system metrics without leaving a terminal session.
LEET reads local
.wandb run files, so you can inspect runs before syncing them to W&B. LEET is a keyboard-driven interface designed for users who work on remote systems or HPC environments using tools like SSH or tmux.
Examples
Open the default workspace:.wandb file:
Views
LEET has three main views: workspace, single-run, and SYMON.Workspace View
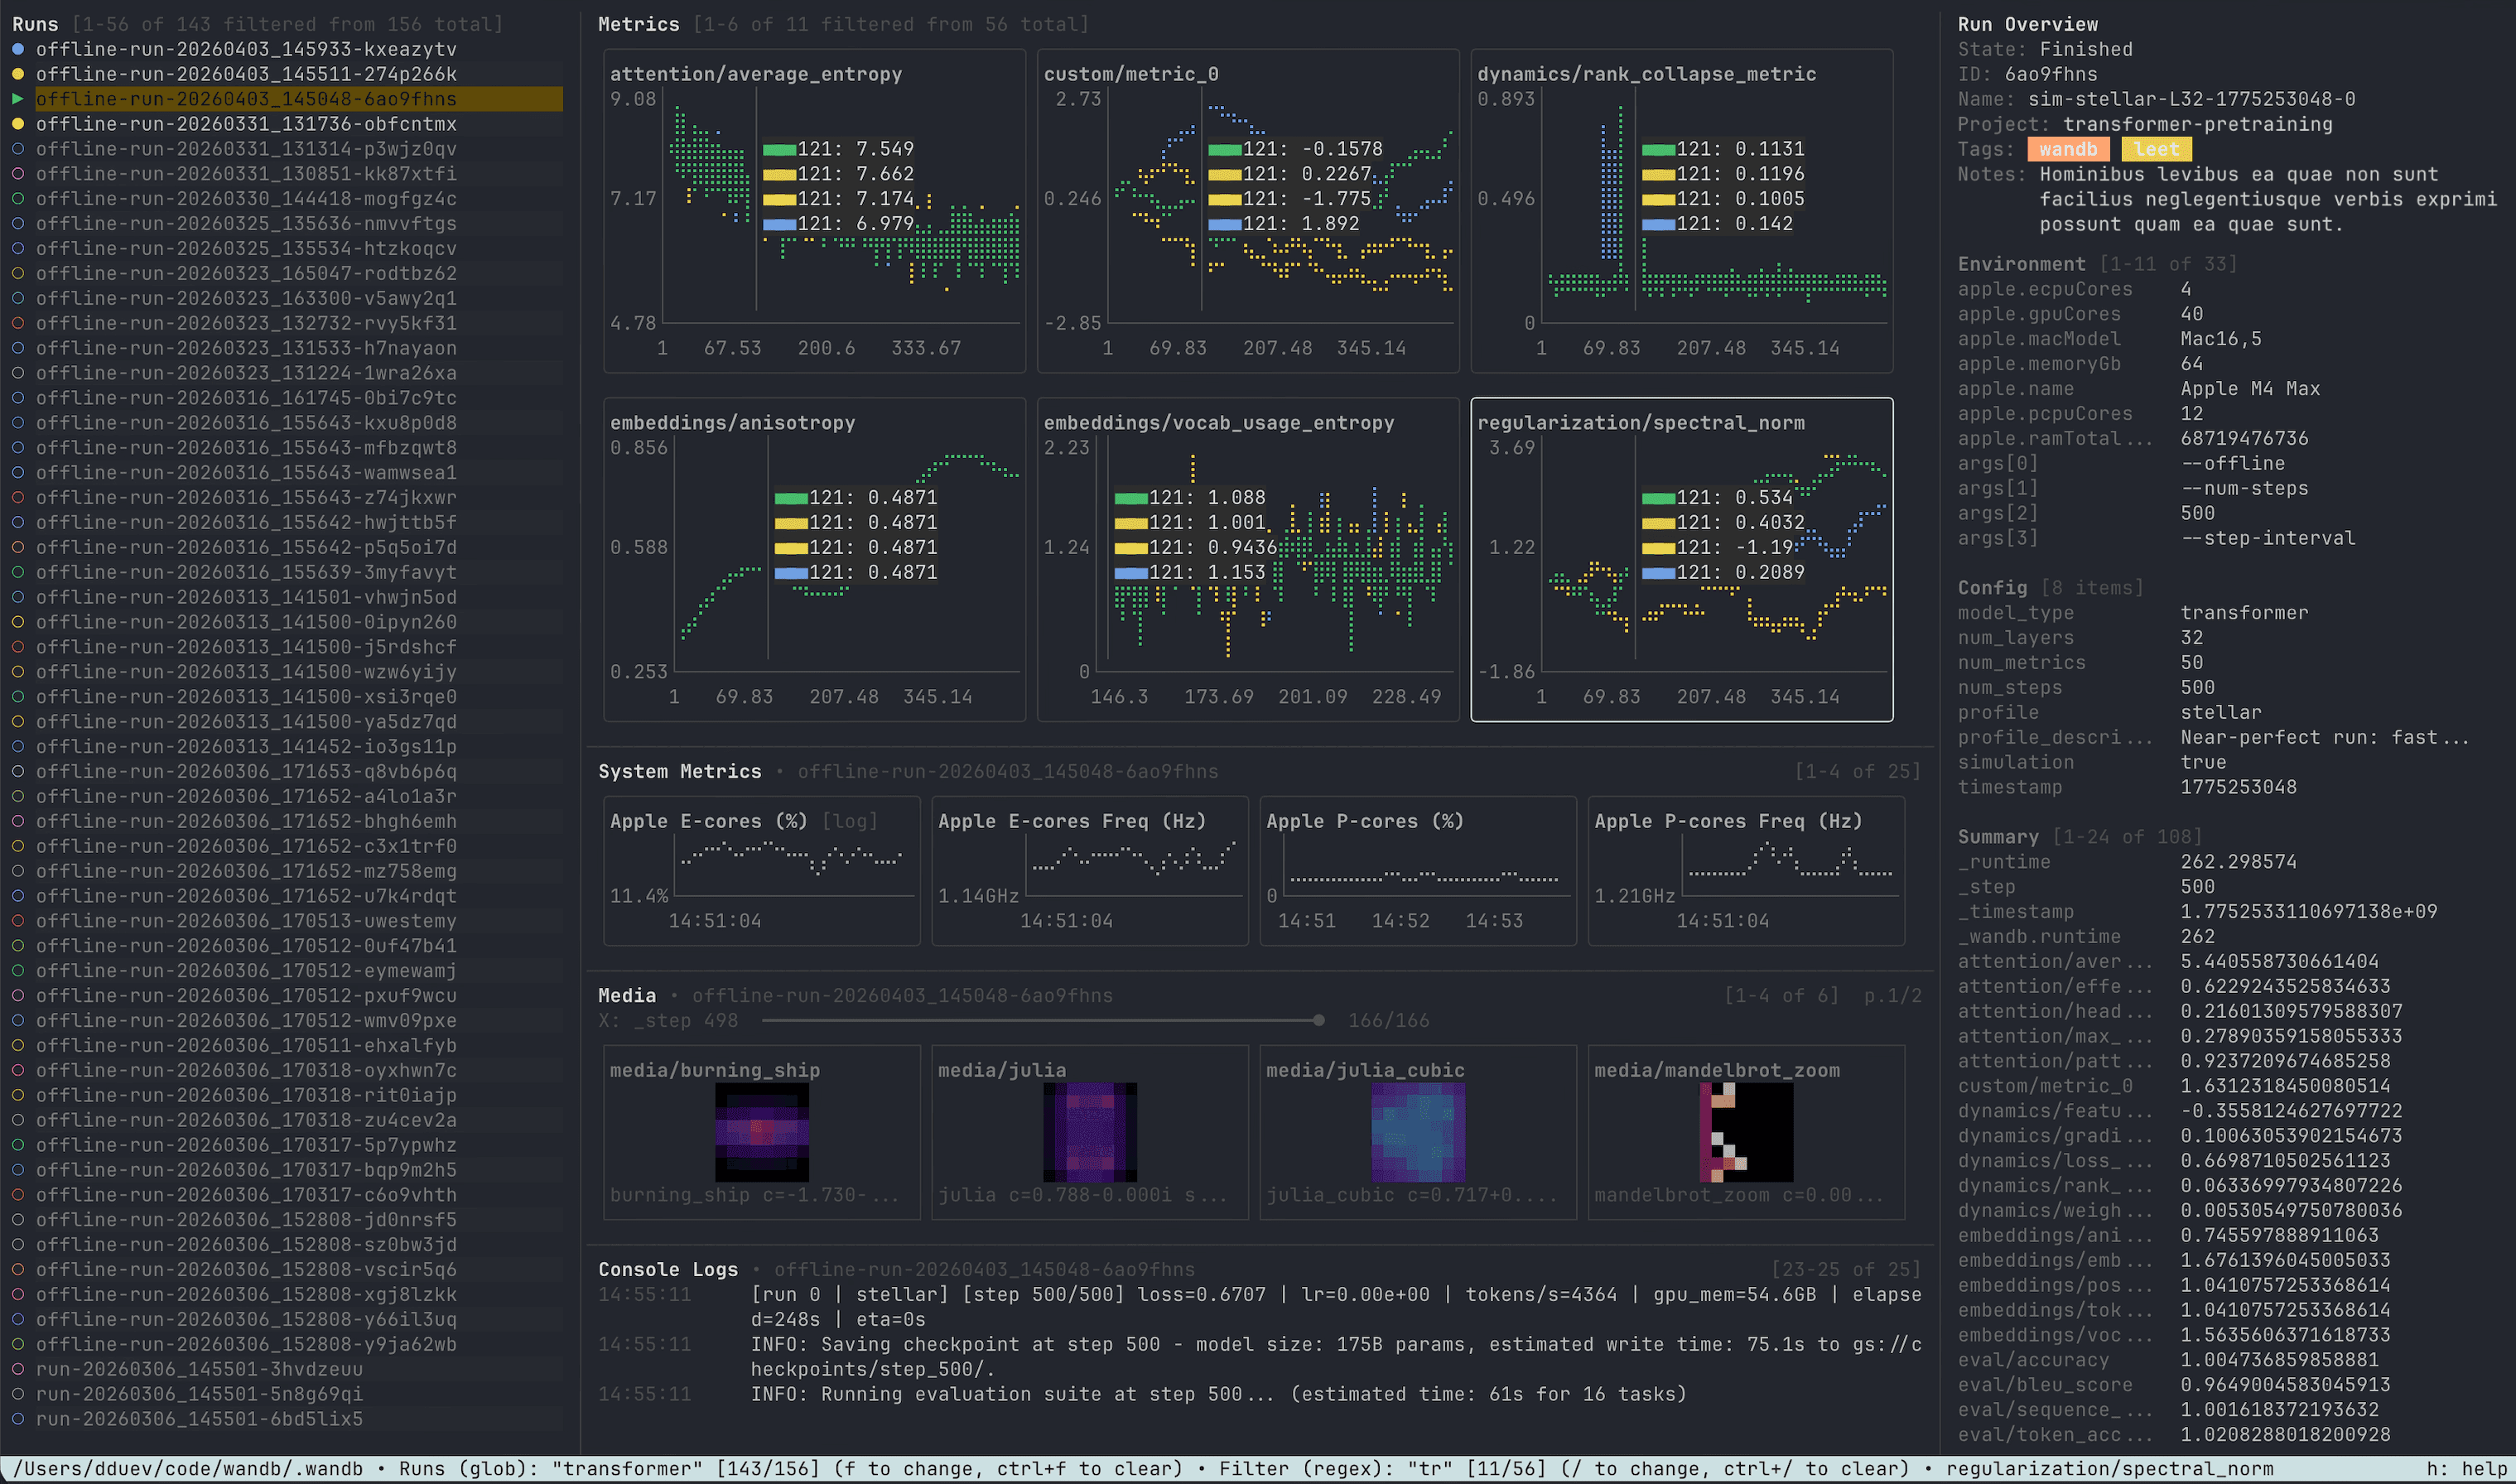
Workspace view is the default LEET experience. It is built for comparing multiple runs from the same localwandb/ directory.
Workspace view includes:
- A runs sidebar for browsing local run folders.
- A metrics grid that overlays selected runs on the same charts.
- A system metrics pane for the highlighted run.
- A media pane for
wandb.Imagethumbnails. - A console logs pane.
- A run overview sidebar with state, ID, name, project, tags, notes, environment, config, and summary values.
space to select or deselect a run. Selecting a run adds it to the overlaid metric charts and loads its run-specific data. Use p to pin or unpin a run. Pinning keeps that run’s metric series on top in overlaid metric charts; the run overview, system metrics, media, and console logs panes follow the run highlighted in the runs sidebar. Press enter on the highlighted run to open it in single-run view.
Selected live runs continue updating in the workspace, so you can use LEET for both post-run analysis and live monitoring.
Single-Run View
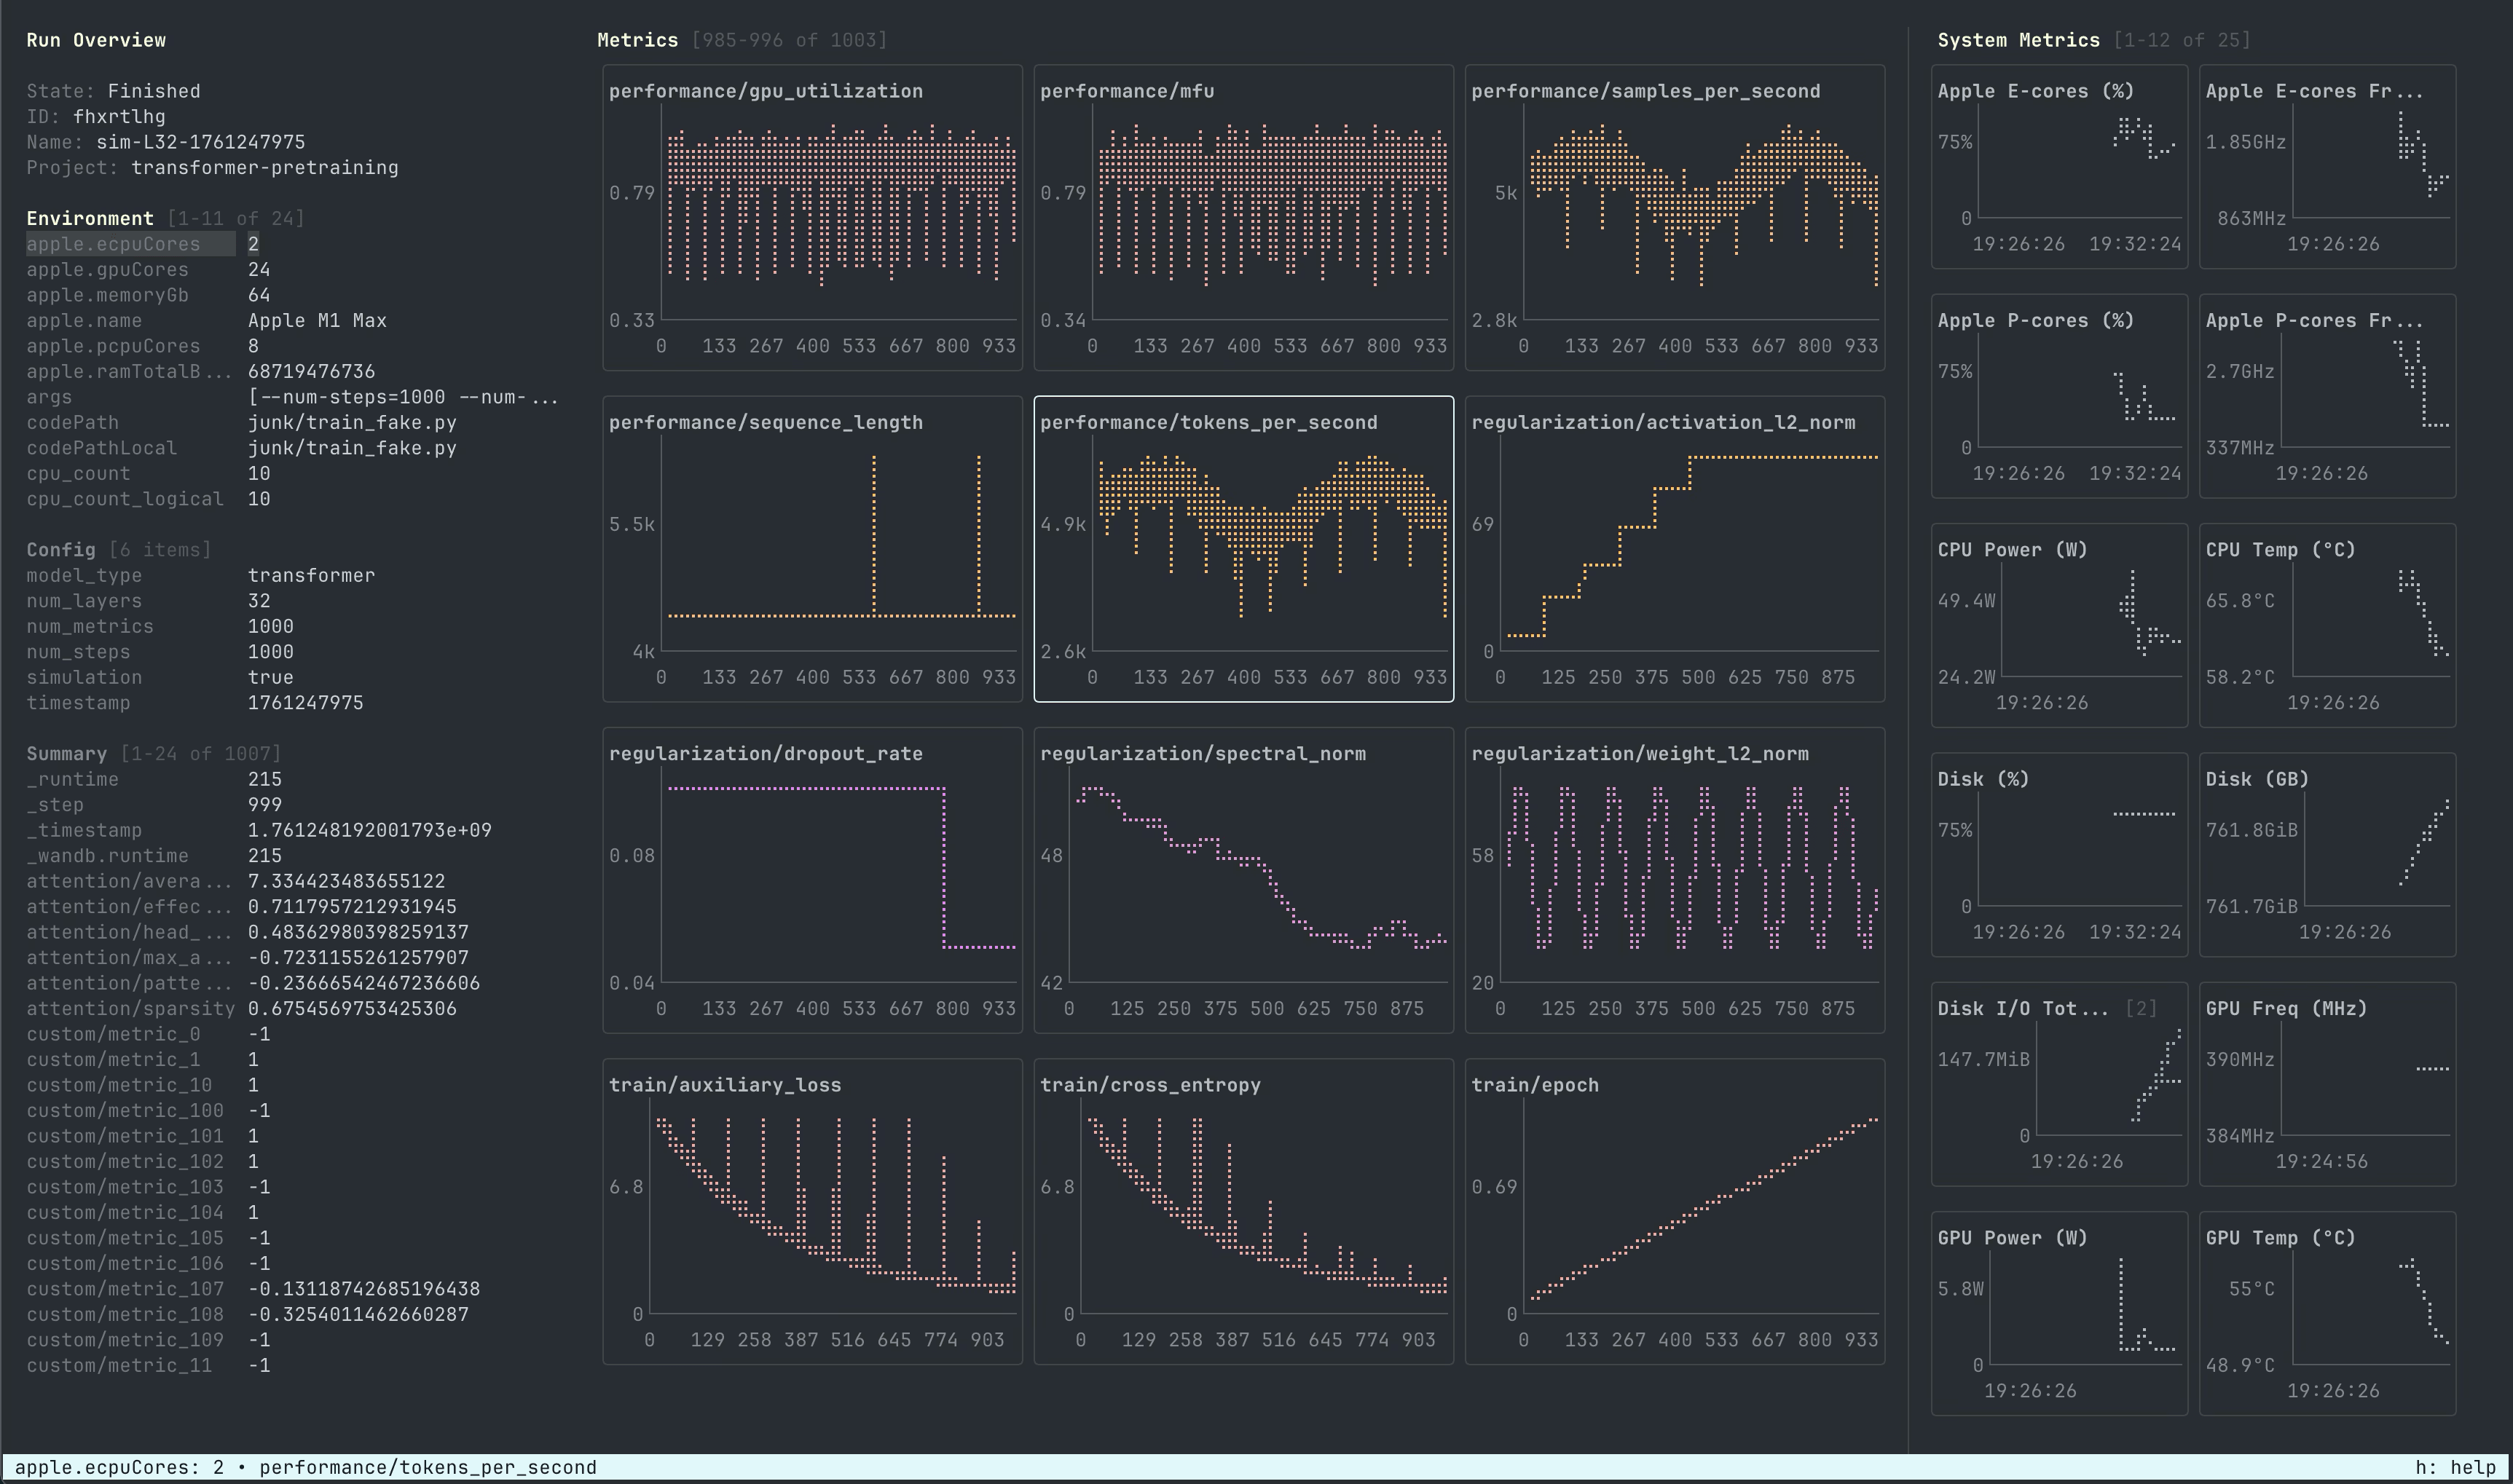
Single-run view focuses on one run. It uses the same chart engine as workspace view, but is arranged around that run:- The main metrics grid is centered.
- The run overview sidebar is on the left.
- The system metrics sidebar is on the right.
- Media and console logs panes can be opened below the metrics grid.
esc to return from single-run view to the workspace.
SYMON
wandb beta leet symon opens a standalone system monitor that is not tied to a W&B run.
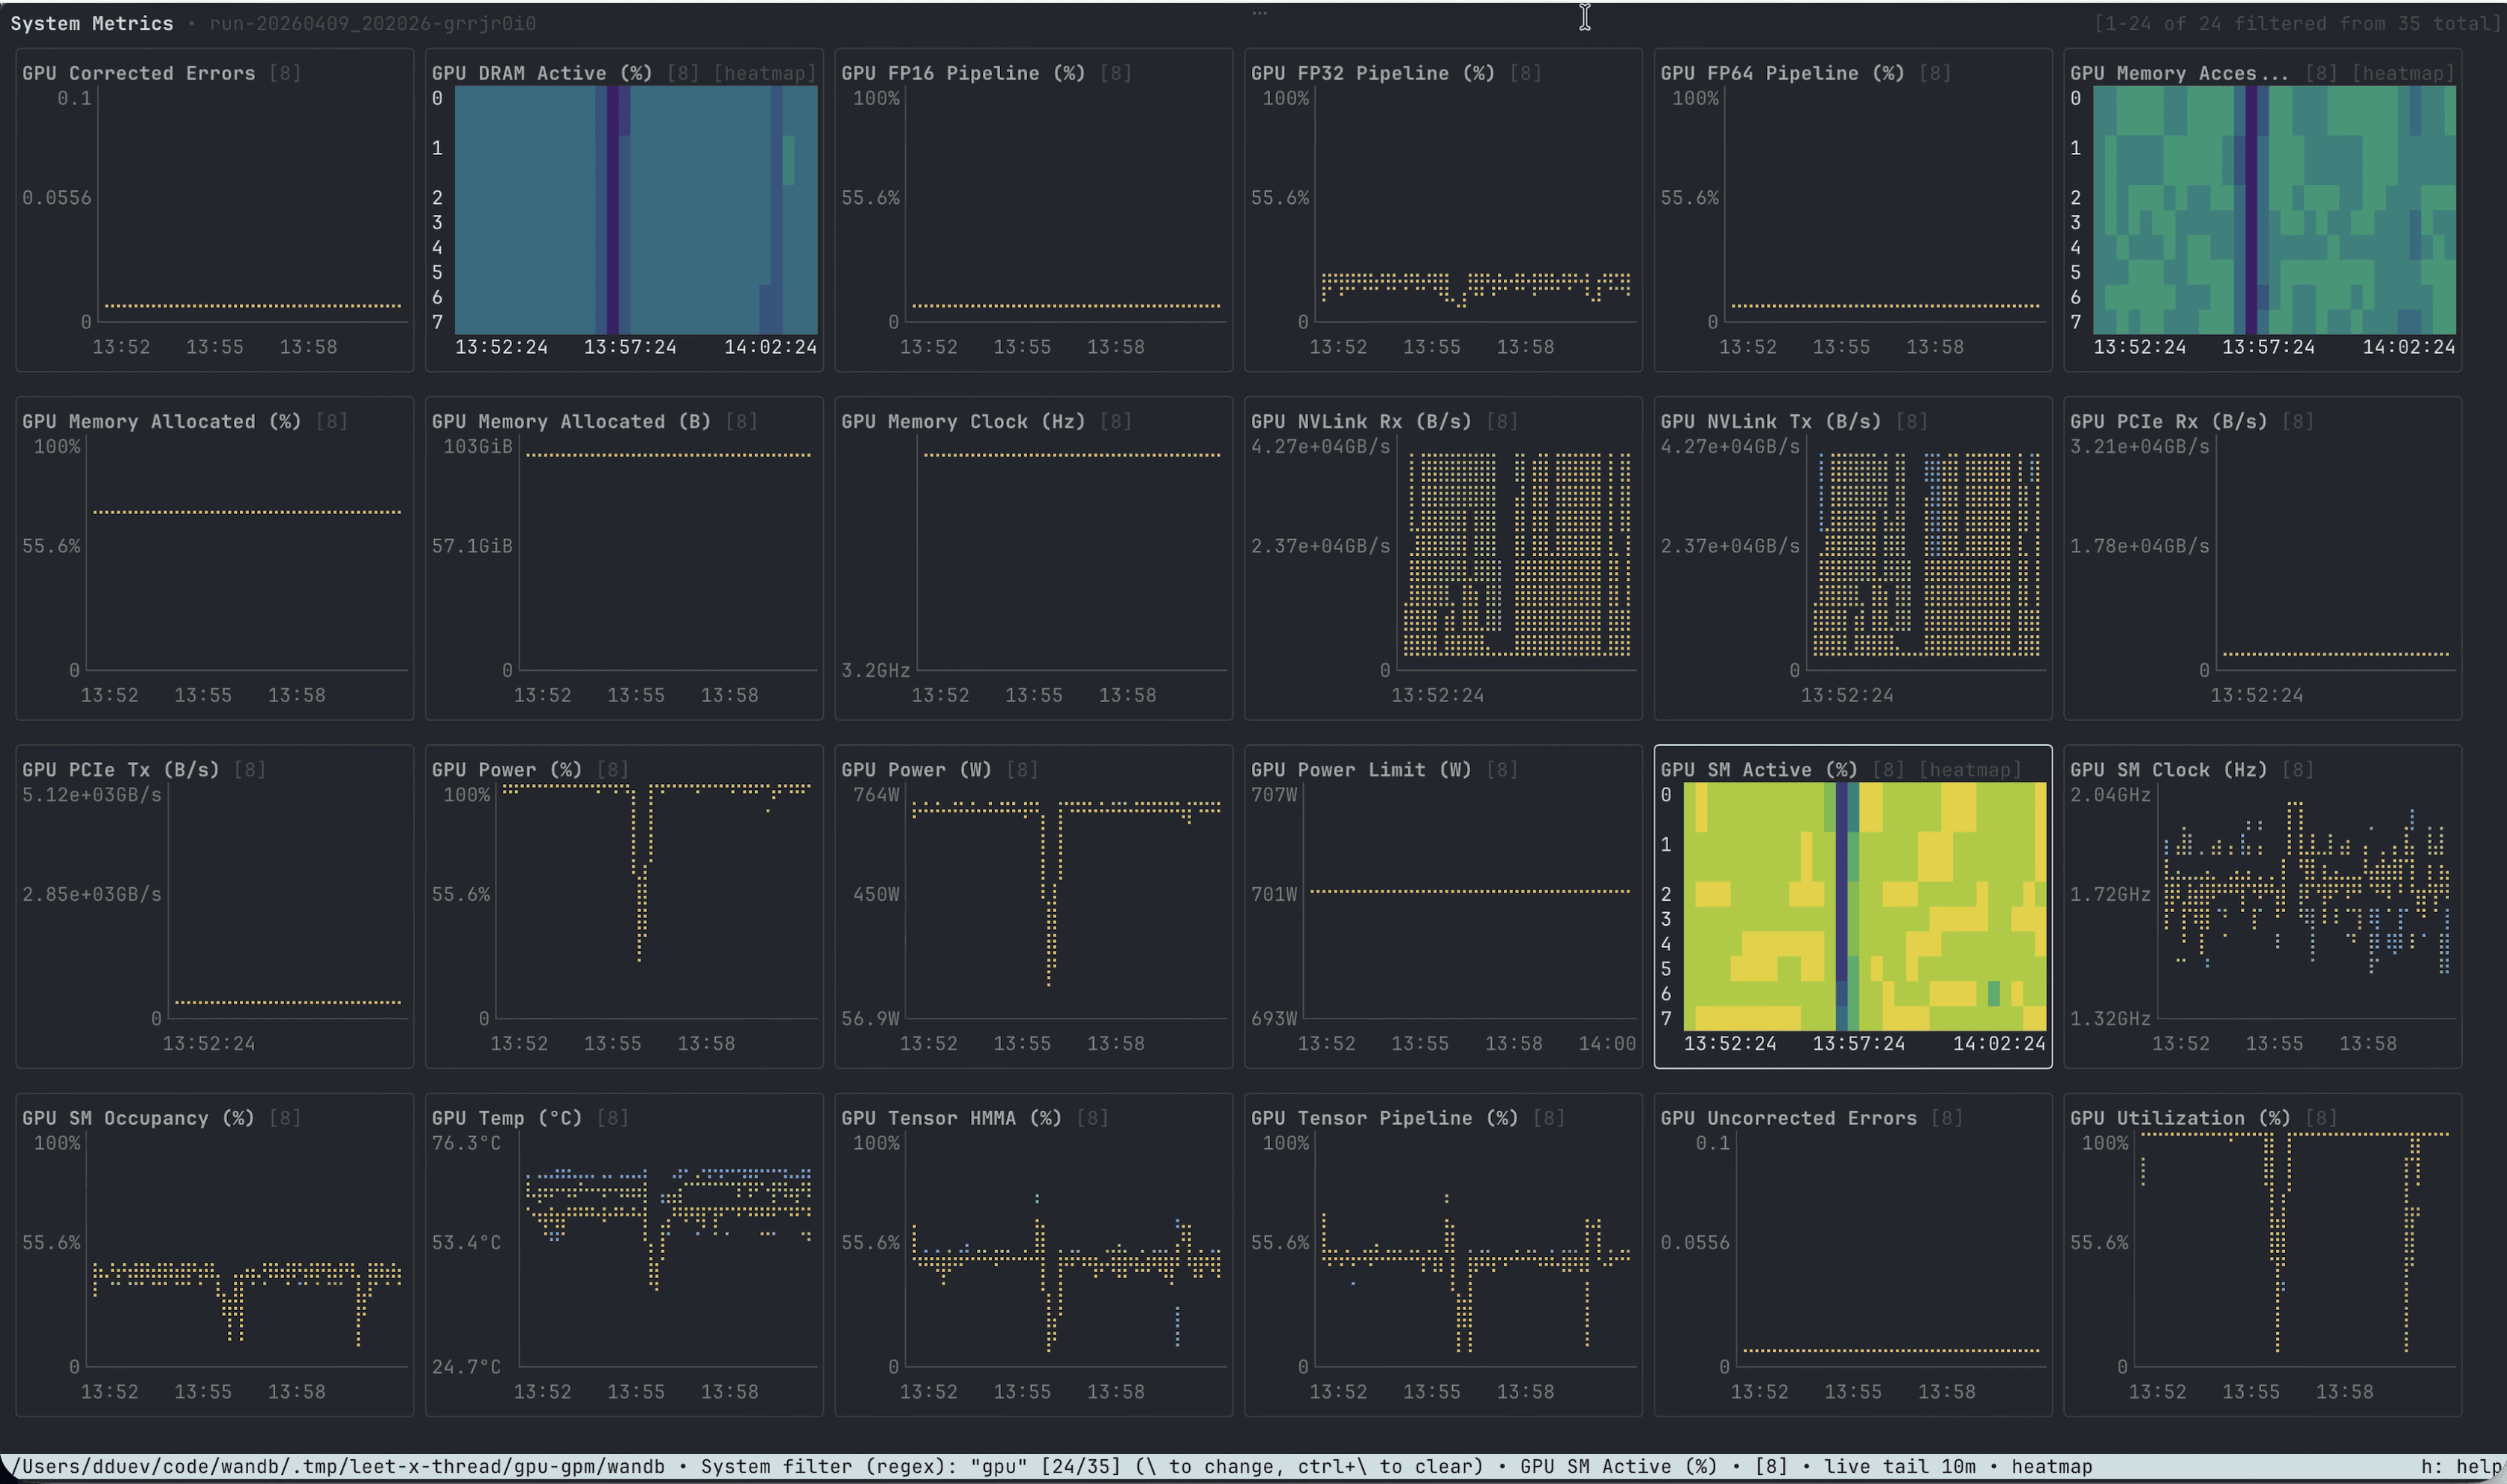
Use SYMON to watch local CPU, memory, disk, network, GPU, TPU, IPU, and Trainium metrics while another process is running. It uses the same system metrics chart engine as the workspace and single-run views.
Set the sampling cadence with --interval:
Key Features
Multi-Run Comparison
Workspace mode lets you select multiple local runs and compare their metric series on the same charts. Each selected run gets a stable color. LEET also avoids base color collisions so visible runs are easier to distinguish. The runs list uses distinct markers for unselected, selected, and pinned runs. Pinning is useful when many runs are selected and you want one run’s metric series to render on top.Run Filtering
Pressf in workspace view to filter the runs sidebar. Bare terms search across run key, display name, run ID, project, tags, and notes.
The runs filter also supports fielded queries:
Supported operators are
:, =, !=, >, >=, <, and <=. Numeric comparisons are useful for config values such as learning rate, batch size, or number of layers.
Use whitespace or AND for conjunction, OR or | for alternatives, and -, !, or NOT for negation. Use quotes for phrases with spaces.
Examples:
tab to switch between regex and glob modes. Regex mode behaves like a case-insensitive substring search unless the query contains regex metacharacters. Glob mode supports * for any sequence and ? for any single character.
Metrics and System Metrics
LEET renders scalar metrics as terminal line charts. Use/ to filter run metrics and \ to filter system metrics. Press ctrl+/ to clear the metrics filter and ctrl+\ to clear the system metrics filter.
Click a chart or move focus with w, a, s, d, or the arrow keys. Use N or pgup for the previous page, n or pgdown for the next page, and home or end to jump to the first or last page.
Press y on a focused chart to cycle chart modes:
- Run metric charts toggle log-scale Y when the chart has positive data.
- System metric charts toggle log-scale Y.
- Percentage-based system metric charts can also switch into bucketed heatmap mode.
alt while right-clicking and dragging to inspect all visible charts at the same X position.
Media Pane
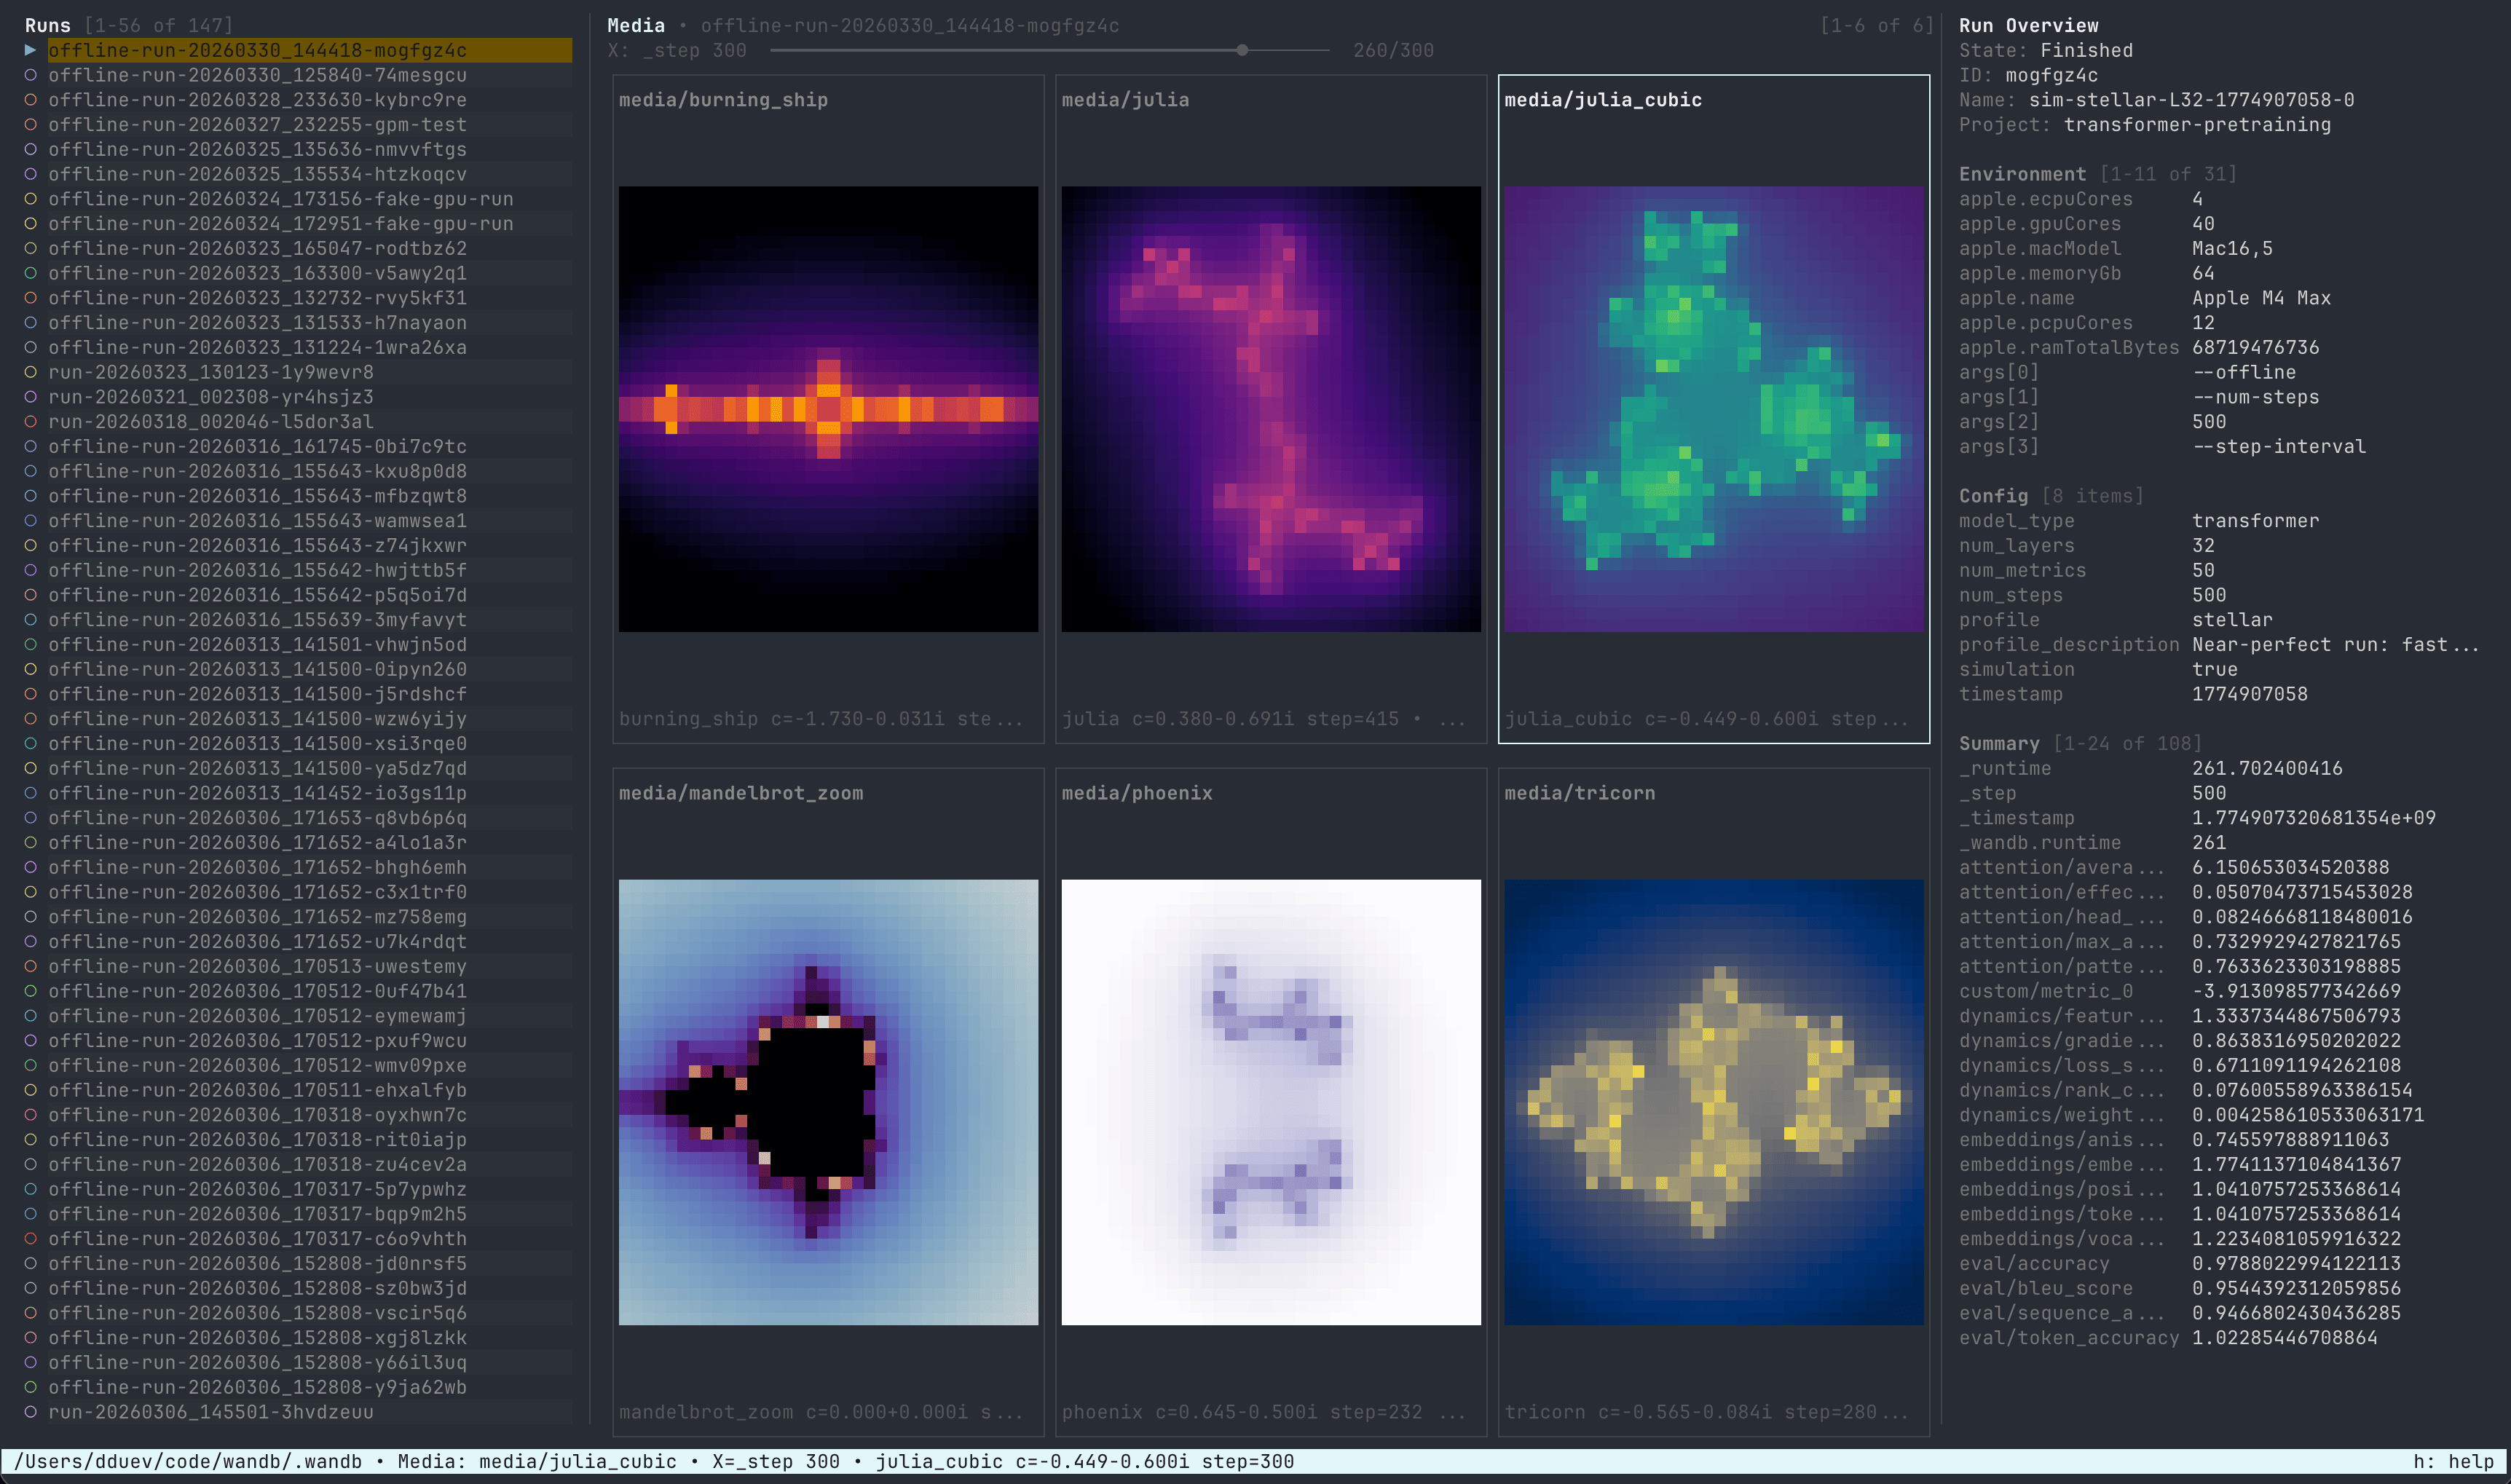
The media pane renderswandb.Image data as ANSI thumbnails directly in the terminal. It is available in both workspace and single-run views.
Open or close the media pane with 3. When the media pane is focused:
w,a,s,dmoves between media tiles.- Arrow keys scrub the selected media series along the X-axis.
upanddownscrub by larger steps.homeandendscrub to the first or latest frame.pgupandpgdownmove between media pages.entertoggles fullscreen mode.escexits fullscreen mode.
Console Logs
Open or close the console logs pane with4. The pane shows console output for the open run in single-run view, or for the highlighted run in workspace view.
LEET assembles raw terminal output into readable log lines, including output that contains ANSI escape codes, partial lines, and carriage returns.
Run Overview
The run overview sidebar shows run metadata and logged values:- State, run ID, display name, project, tags, and notes.
- Environment values.
- Config values.
- Summary values.
o to filter overview items. Press ctrl+o to clear the overview filter.
System Metrics Coverage
The system metrics pane and SYMON can display host and accelerator metrics when those metrics are available from the local run file or live sampler. Supported chart definitions include:- CPU, per-core CPU, Apple P-core and E-core utilization, CPU frequency, CPU temperature, and CPU power.
- RAM, swap, process memory, process CPU, process thread count.
- Disk usage and disk I/O.
- Network receive and transmit throughput.
- NVIDIA GPU utilization, memory, power, temperature, clocks, errors, encoder utilization, PCIe and NVLink throughput.
- NVML GPM metrics on supported Hopper and newer NVIDIA GPUs, including SM active, SM occupancy, tensor/FP pipeline activity, and DRAM active.
- Google TPU duty cycle, tensorcore utilization, HBM usage, HLO queue size, transfer latency, and SDK-only TPU gauges when available.
- Graphcore IPU temperature, clock, power, and utilization.
- AWS Trainium and Neuron utilization and memory metrics.
Configuration
Run the config editor with:wandb-leet.json. By default, the file is written under:
WANDB_CONFIG_DIR is set, LEET uses that directory instead.
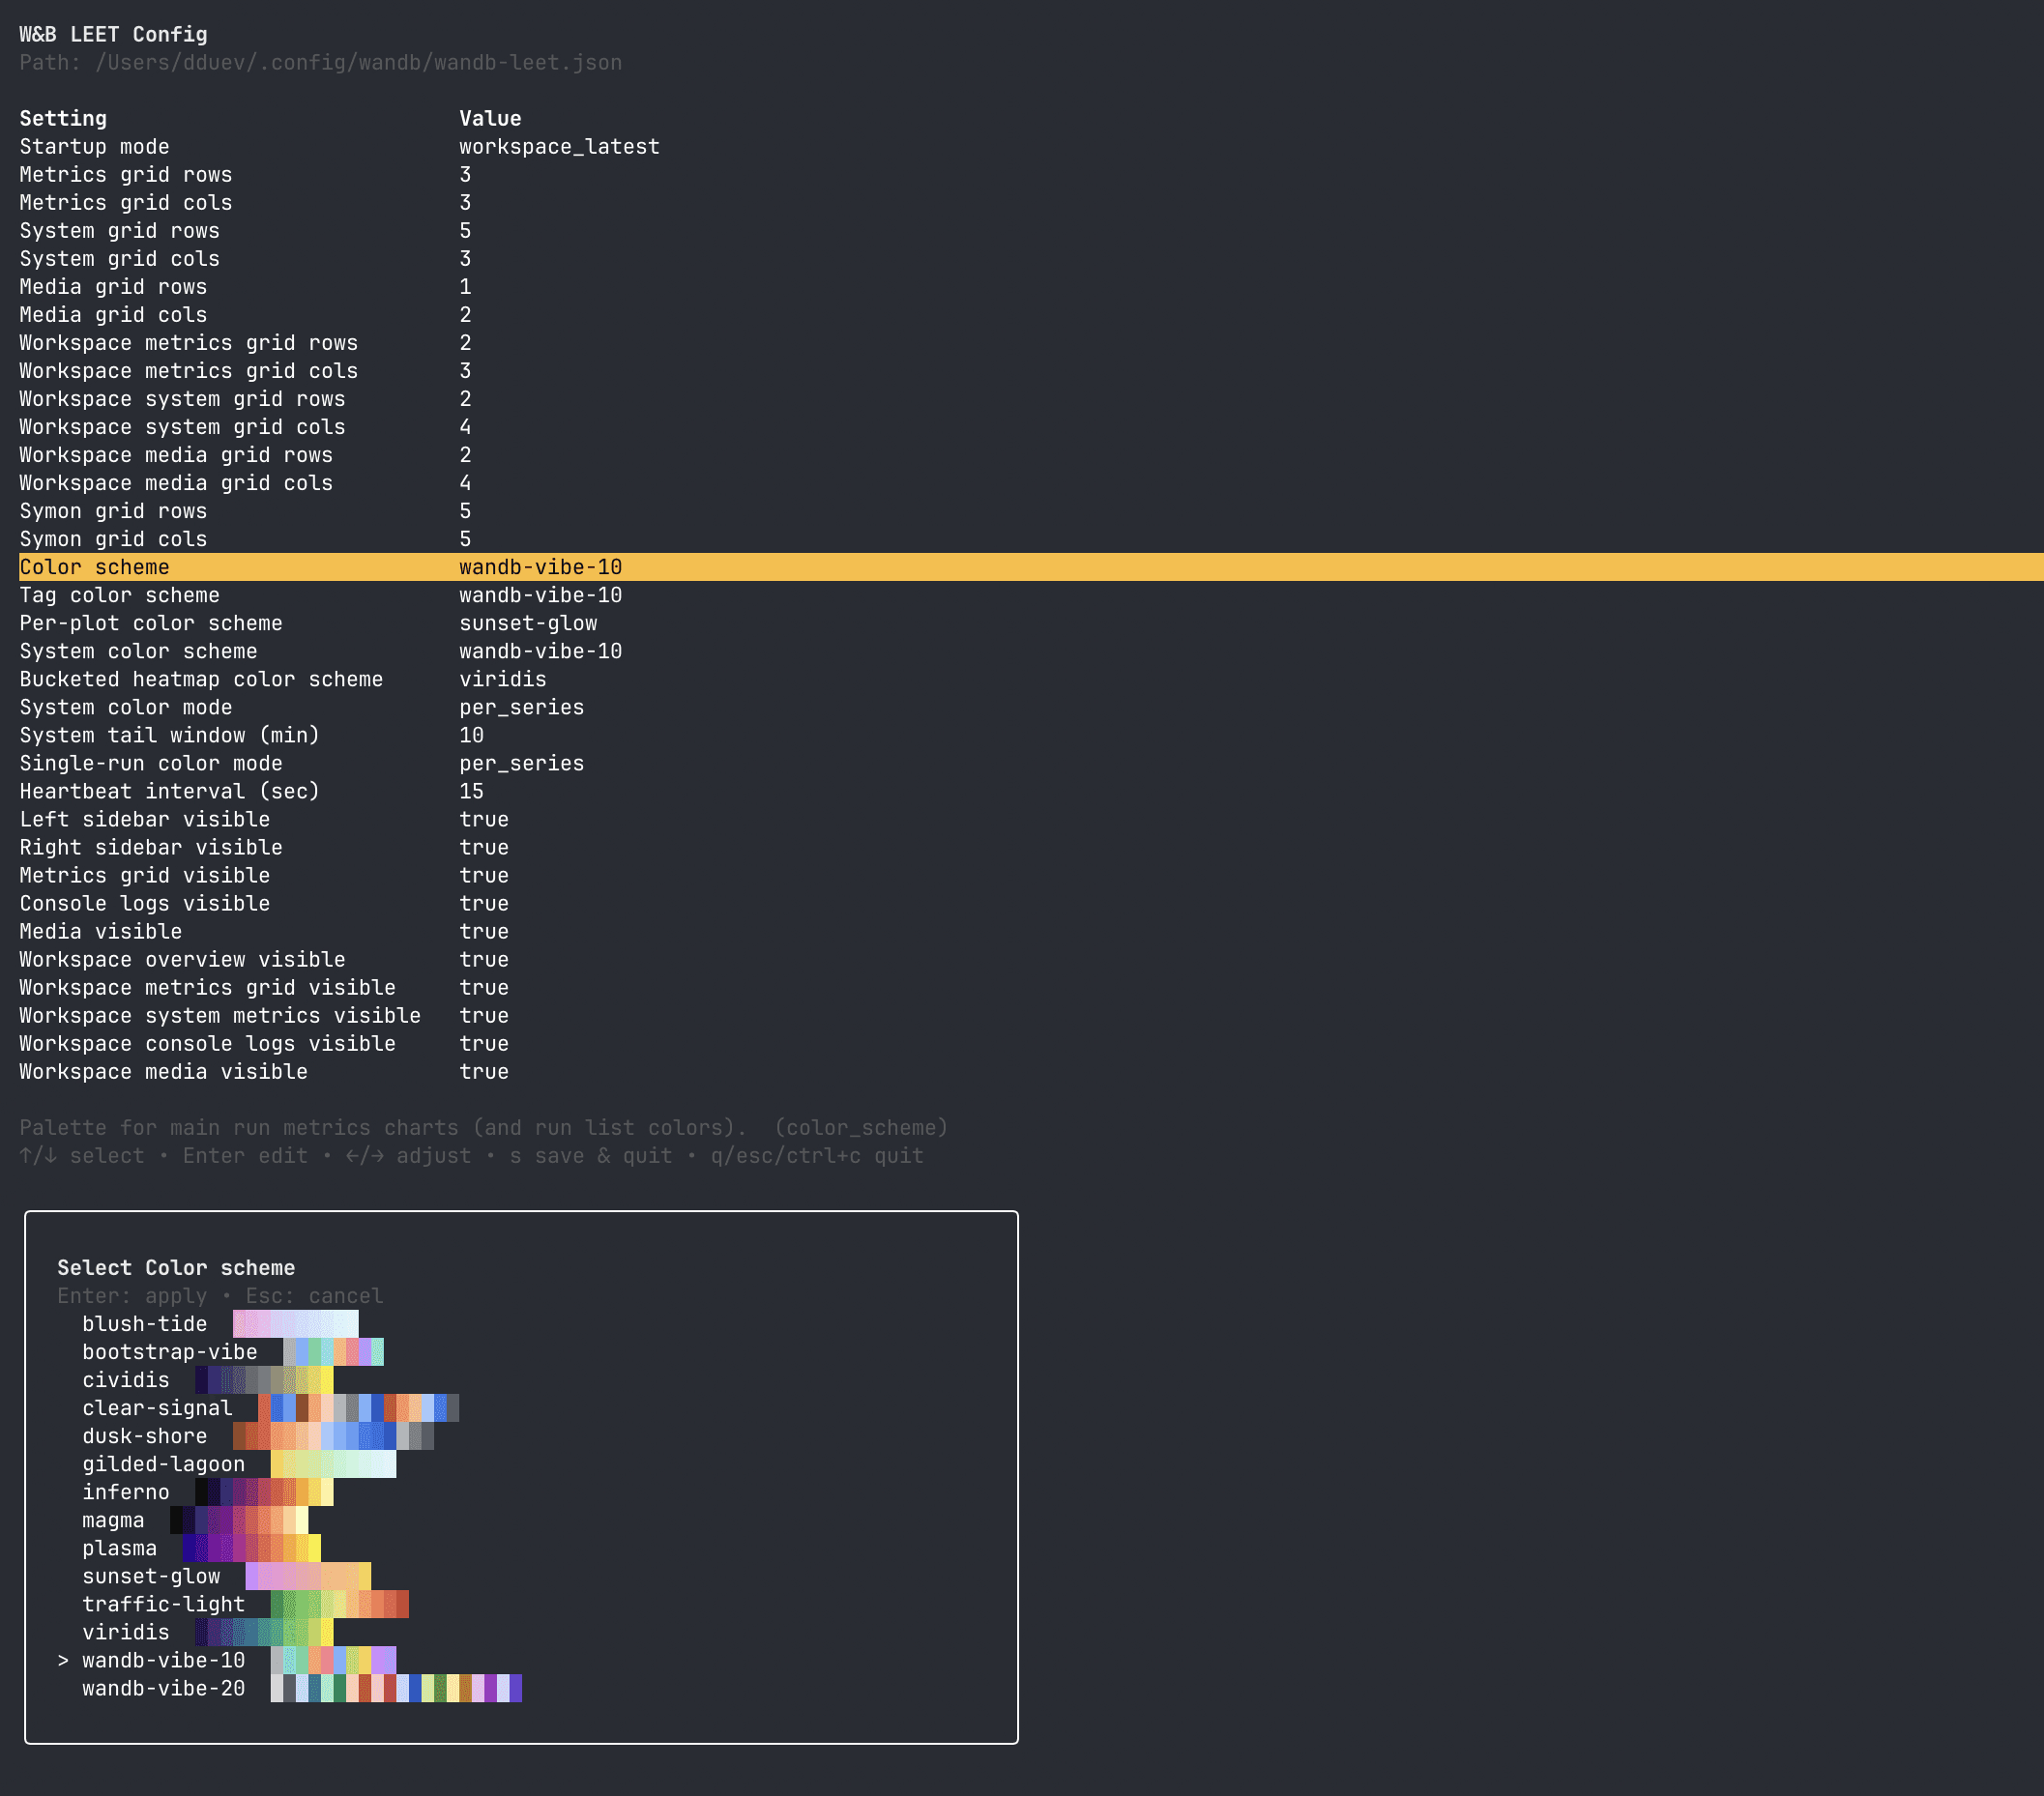
The config editor lets you change:
- Startup mode:
workspace_latestorsingle_run_latest. - Grid sizes for workspace, single-run, media, system metrics, and SYMON views.
- Which panes are visible by default.
- Color schemes for run metrics, per-plot single-run charts, system charts, run tags, and bucketed heatmaps.
- Color assignment mode:
per_seriesorper_plot. - System metrics live-tail window.
- Heartbeat interval for live run updates.
After pressing
c or r, press a digit from 1 to 9, or press esc to cancel.
Common Config Keys
Available color schemes include
wandb-vibe-10, wandb-vibe-20, sunset-glow, blush-tide, gilded-lagoon, bootstrap-vibe, dusk-shore, clear-signal, traffic-light, viridis, plasma, inferno, magma, and cividis.
dusk-shore and clear-signal are colorblind-friendly palettes. Sequential palettes such as viridis, plasma, inferno, magma, cividis, and traffic-light work well for bucketed heatmaps.
Keyboard Shortcuts
Pressh or ? inside LEET to open the in-app help screen. Shortcuts vary slightly by view.